How to Turn Trading Observations Into Testable Rules
You finished a session. Something stood out. Maybe ES broke the opening range at 9:37 ET with ADD (the NYSE breadth indicator measuring advancing versus declining stocks) above +500 and ran 12 points without pulling back. Third time this week.
That's an observation. Not a rule yet.
The gap between the two is where most traders lose money quietly. You notice something, scribble it in a journal, feel productive, and never act on it again. (If your journal is full of notes like "be patient" and "stop overtrading," here's why those never work.) I did this for months before I figured out the problem: I had no process to convert what I was seeing into something testable.
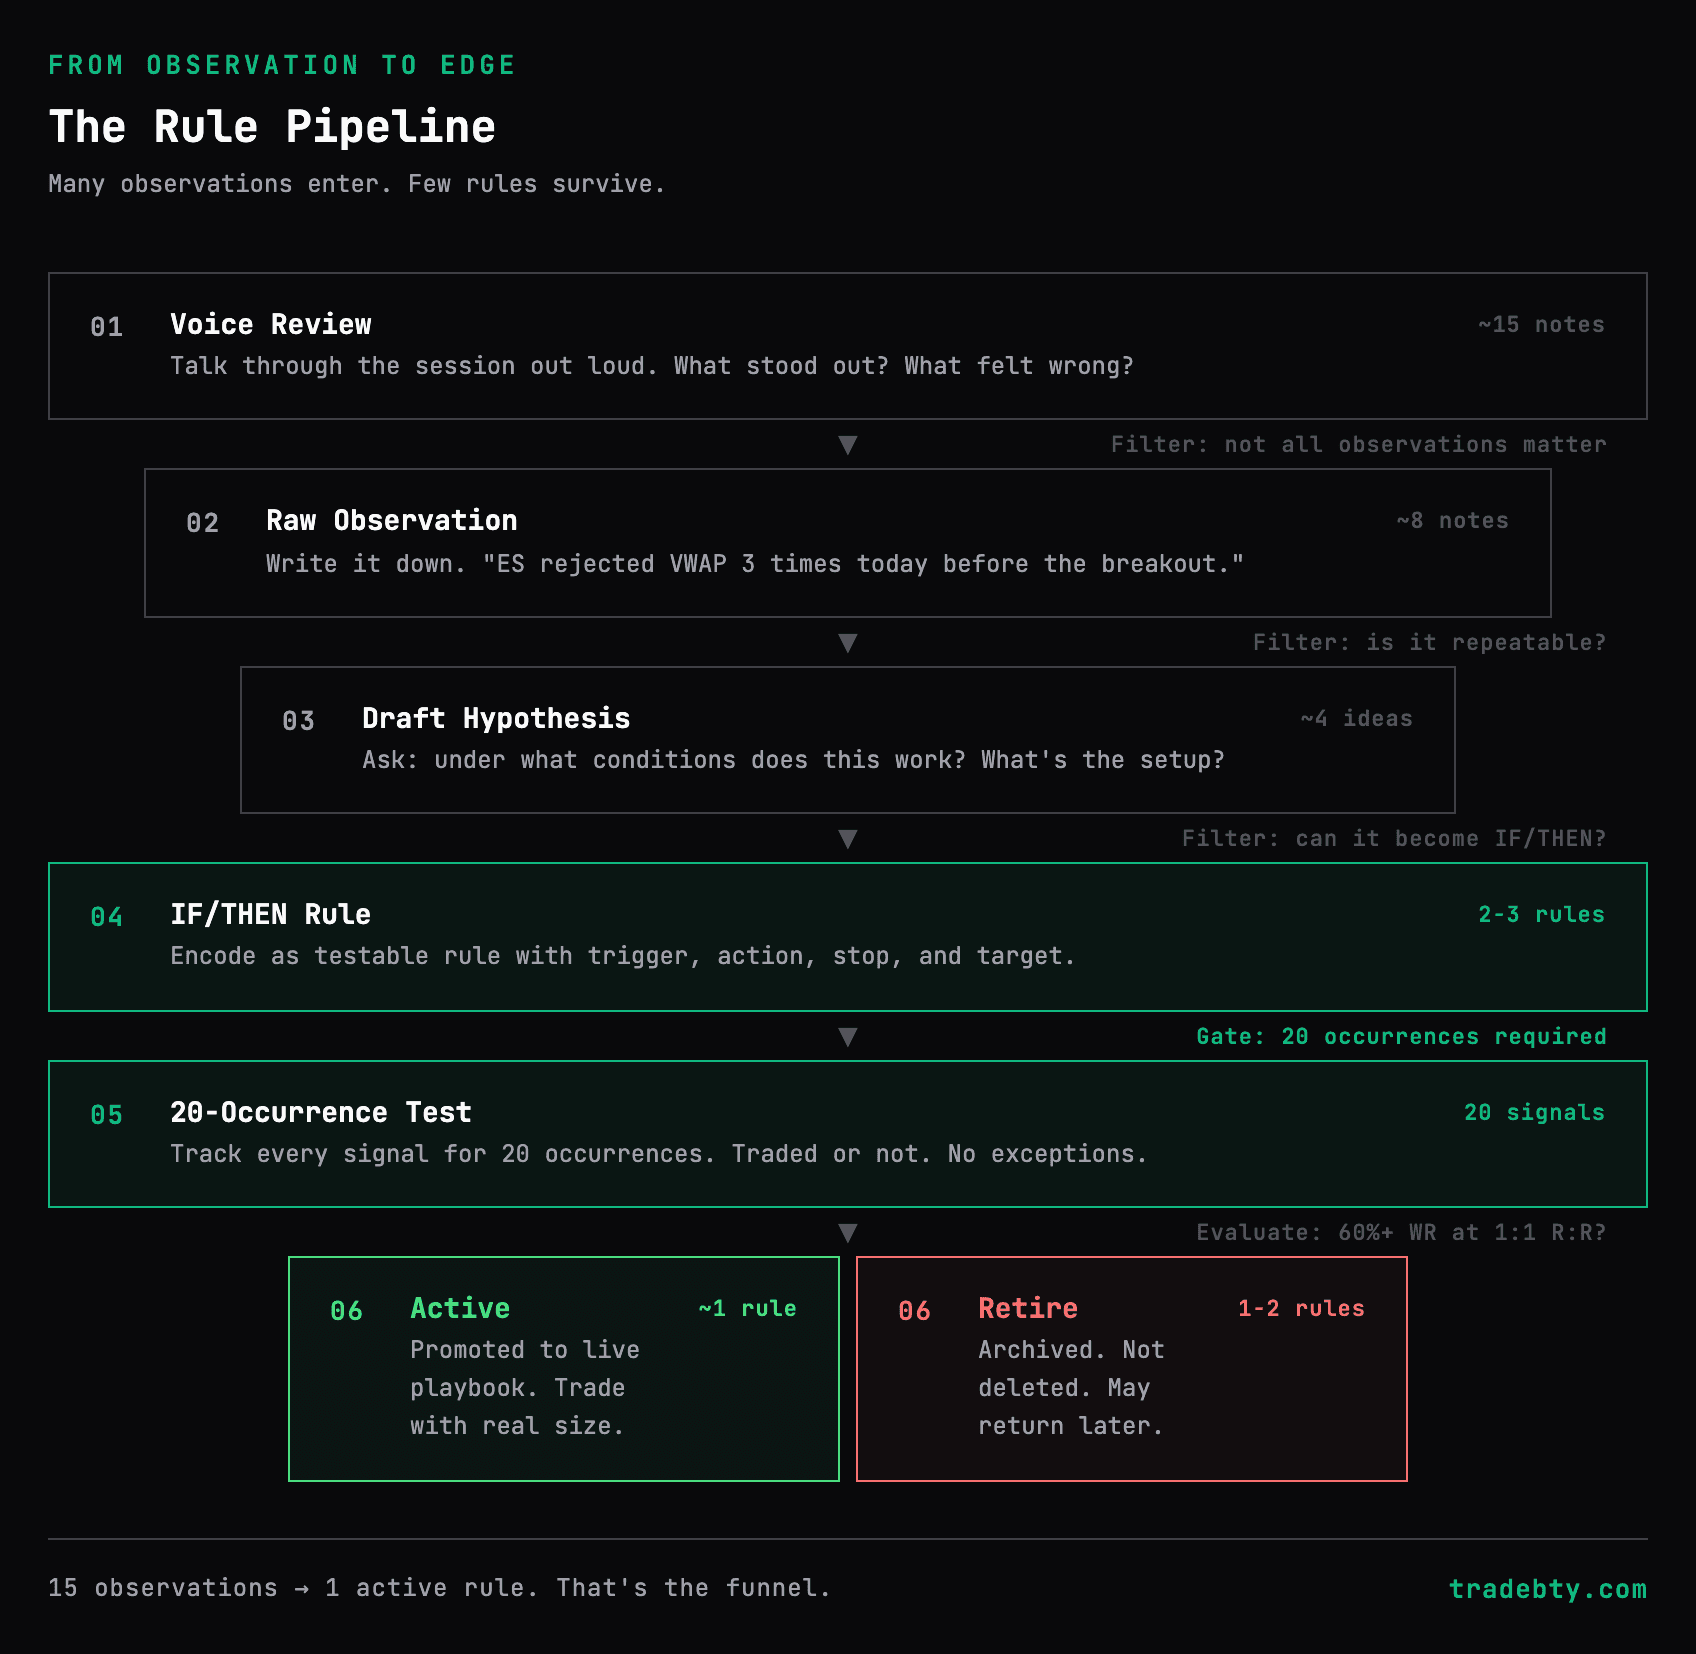
The fix is a three-step pipeline: Draft a rule. Track it 20 times. Promote or retire it.
What Makes a Good Observation
Not all observations are worth converting. Some are noise. Learning to filter early saves you from building rules on garbage data.
Good observations are specific. "ES broke the OR at 9:37, ADD was above +500, held for 2 minutes, ran 12 points." That has a time, a confirmation signal, a hold duration, and a measured outcome. You can work with this.
Bad observations are vague. "Breakouts worked today." Worked how? Which breakouts? With what confirmation? This is an impression, not an observation. You can't build a rule from it because there's nothing to encode.
Good observations repeat. One occurrence is an anecdote. Two is a coincidence. Three is a pattern worth investigating. If you notice something once, write it down. If you notice it three times in a week, it's time to draft a rule.
Bad observations are outcome-biased. "I should have held longer -- it ran 20 points after I exited." That's hindsight, not a pattern. The observation is only useful if you can identify the signal that would have told you in real time to hold. If there was no signal, there's no rule to build.
Here's a quick filter: before you invest time drafting a rule, ask "would I have noticed this if the trade had lost?" If the answer is no, you're looking at outcome bias, not a pattern.
Capturing Observations Without Friction
Here's the thing about observations -- they happen right after the close, when your memory is fresh and your energy is low. That's exactly why a voice review works. You talk for 90 seconds about what stood out. "ES broke the OR at 9:37, ADD was above 500, held for 2 minutes, ran 12 points clean. Third time this week that hold-time filtered breakout worked." Done.
The AI extracts the pattern details. You review them, tweak anything it missed, and now you've got a structured observation instead of a mental note that evaporates by dinner. (The full 9-section review template captures observations alongside turning points, plan compliance, and key takeaways in one pass.)
The alternative -- typing detailed notes manually -- works in theory and fails in practice. You're tired. You'll cut corners. You'll write "breakouts worked" instead of "OR break at 9:37, ADD +500, 2-min hold, 12 points." Voice captures the detail. Typing skips it.
The Observation-to-Hypothesis Pipeline
Converting an observation into a rule is not a single step. It's a pipeline with three stages, and skipping any stage produces weak rules.
Stage 1: Raw observation. What happened, when, with what confirming signals. No interpretation yet. Just facts. "ES gapped down 0.8%, faded to VWAP by 9:50, bounced 9 points off VWAP with TICK flipping from -400 to +200."
Stage 2: Hypothesis. Why did it work? What were the conditions? What would have to be true for this to work again? "Gap fades to VWAP tend to bounce when the gap is between 0.5% and 1.0% and TICK shows buyers stepping in at VWAP." Now you have a theory.
Stage 3: Draft rule. Encode the hypothesis as an IF/THEN with explicit conditions, entry, stop, and target. "IF ES gaps down 0.5%-1.0% AND price reaches VWAP within 30 minutes AND TICK crosses above zero at VWAP, THEN enter long. Stop: 3 points below VWAP. Target: fill 50% of the gap."
Most traders jump from Stage 1 straight to Stage 3 -- or worse, they skip the pipeline entirely and just "remember" the pattern. The hypothesis stage matters because it forces you to articulate what made the setup work. Without it, you're encoding noise.
From Observation to Draft Rule
Take the observation and ask: "Under what conditions did this work?" Encode the answer as an IF/THEN.
A good rule has two layers:
Context filters (broad) -- decide whether the setup is even in play today. Gap size, VIX level, day of week, overnight range. They answer: "Is this the right environment?"
Entry rules (specific) -- define the exact trigger. Price level, hold time, confirmation signal. They answer: "Is this the exact moment to act?"
Separating the two matters more than you'd think. A breakout entry that works in low-VIX trending days will chop you up in a high-VIX range session. The context filter catches that before your entry rule fires.
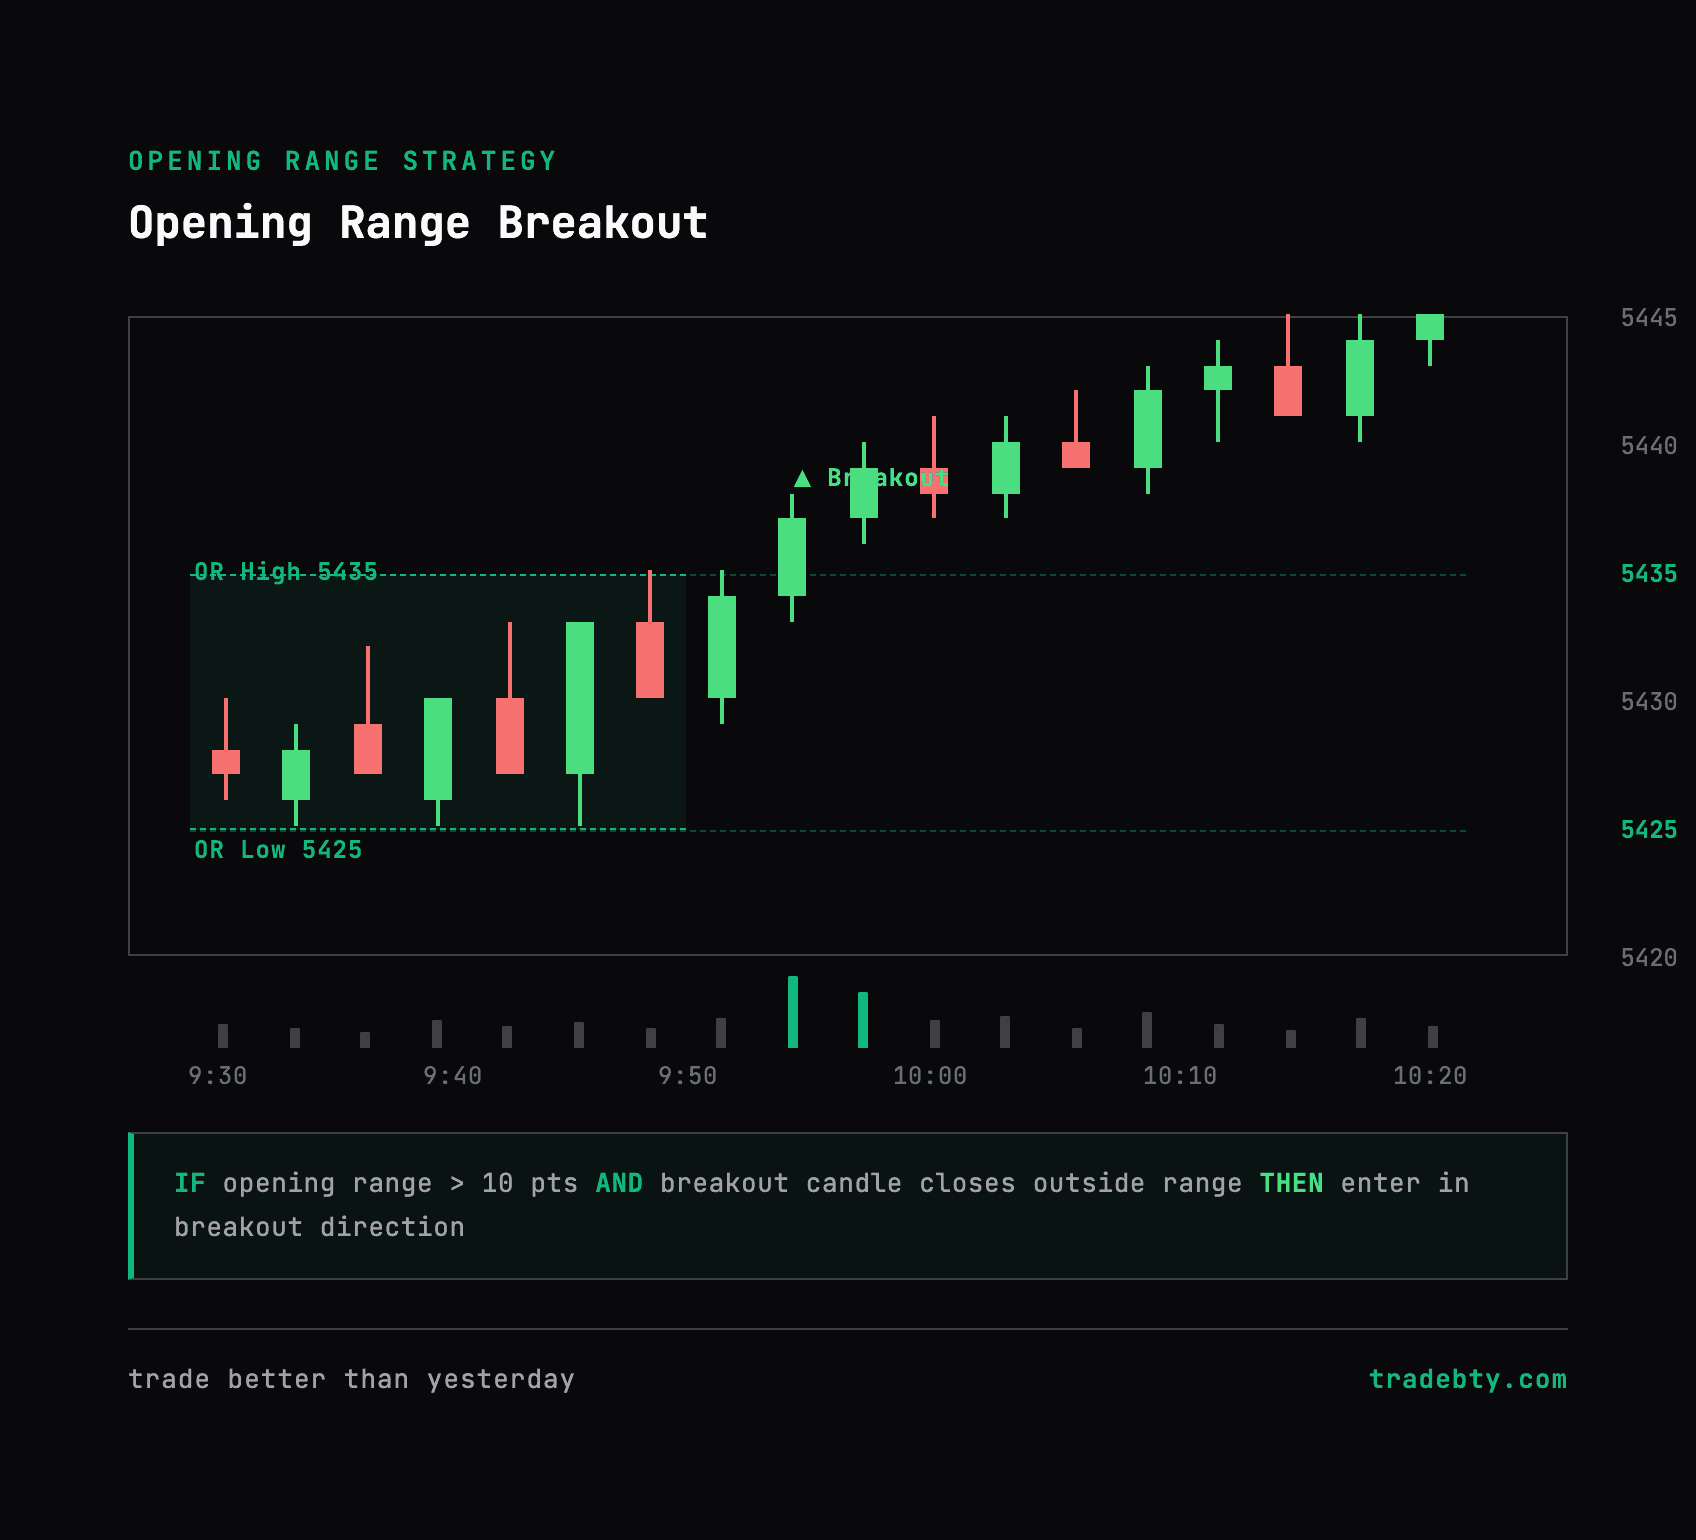
Draft rule: "IF ES breaks the 5-minute opening range high AND price holds above the OR high for 2 minutes AND VWAP is below the breakout level, THEN enter long, stop 4 points below OR high, target 1.5x the opening range width."
Context filter: VIX below 18, gap less than 0.5%. Entry rule: OR break + 2-minute hold + VWAP below breakout.
That's a hypothesis in executable format. Five trades is noise. You need 20 occurrences before the data means anything.
Refining Vague Observations Into Testable Rules
Most observations start vague. That's fine. The work is in the refinement. Here's what that looks like:
Observation: "Breakouts at the open keep failing."
Refinement 1: "What do I mean by 'failing'?" They reverse within 3-5 minutes. Okay.
Refinement 2: "When do they fail?" Mostly when the opening range is narrow -- under 8 points.
Refinement 3: "Do they always fail with narrow ORs?" No. They fail when ADD doesn't confirm direction at the breakout.
Draft rule: "IF the opening range is less than 8 points AND price breaks above/below the OR without ADD confirming direction, THEN fade the breakout. Enter on the first 1-minute close back inside the range. Stop: 2 points beyond the OR extreme. Target: VWAP."
That took four questions to get from "breakouts keep failing" to a rule you can track. Each question tightened the conditions. This is the process. It's not glamorous, but it works.
The Tracking Table
This is where most people quit. Tracking means logging "no signal today" on slow days and recording the trade you skipped because you hesitated.
| Date | Condition? | Traded? | Result | Notes |
|---|---|---|---|---|
| Mon 2/3 | Yes | Yes | +9 pts | Clean breakout, ADD +700 at trigger |
| Tue 2/4 | No | -- | -- | OR too narrow, no trigger |
| Wed 2/5 | Yes | Yes | -3.5 pts | Breakout faded at prior day high |
| Thu 2/6 | Yes | No | Would have won (+7 pts) | Hesitated after yesterday's loss |
| Fri 2/7 | Yes | Yes | +11 pts | Textbook. Held above OR high 3 min. |
Wednesday's loss isn't a rule failure -- it's a missing filter. Prior day high was sitting right there as resistance, and I didn't account for it. Fix: add "no major resistance within 1x the opening range width above the breakout level" to the context filter. One loss, one refinement.
The "would have won" entries matter too. They tell you whether fear is editing your playbook for you. That Thursday skip after Wednesday's loss? Plan Compliance catches that -- you had a rule, conditions were met, and you didn't follow it. A tracking table surfaces this. A journal never does. (This is the same pattern behind revenge trading -- a loss changes your behavior on the next signal, even when the signal is valid.)
How Many Observations Before You Have a Rule?
This is the question everyone asks, and the honest answer is: it depends on the observation.
One observation is never enough. Not even if it's a 20-point winner. One data point tells you nothing about reliability.
Three similar observations in a short window -- same week, similar conditions -- is enough to draft a rule and start tracking. You're not committing to the rule. You're committing to testing it.
Twenty tracked occurrences is enough to evaluate. That's the bar for promotion or retirement. At 20 signals, you have a sample that's small but usable. Win rate, average gain, average loss, and maximum drawdown start to mean something.
Don't wait for 20 observations before drafting. Draft at 3, track to 20, decide at 20. The pipeline is draft early, evaluate late.
Evaluate at 20 Occurrences
After 20 tracked signals:
- -Win rate above 60% with reasonable R:R? Promote to your active playbook. (Use a risk/reward calculator to check whether your average R:R justifies the win rate.)
- -Below 40%? Refine the filters or discard.
- -Between 40-60%? Look for a sub-condition. Maybe it only works when VIX is below 18, or only before 10:30 ET. Tighten the conditions.
Refinement means tightening filters, not rewriting the concept. Changing from breakouts to mean-reversion isn't a refinement -- that's a different hypothesis.
Tracking Rule Effectiveness Over Time
A rule that passes the 20-occurrence test isn't done being tracked. It earned a spot in your active playbook, but markets change. A rule that ran 68% in February might decay to 45% by April.
Track two numbers on every active rule: lifetime win rate and recent win rate (last 5-7 occurrences). Lifetime is your confidence number. Recent is your early warning system. When recent drops below 40% while lifetime is still above 60%, something changed. That's a decay signal.
Your morning prep should surface this data before the bell. "Gap fade rule: lifetime 68%, recent 3 of last 7 (43%). Watch status recommended." You see that at 9:10 ET and adjust before you take a decayed setup at full size.
Promote or Retire
Rules that pass testing earn a spot in your active playbook. Rules that fail go to inactive -- not deleted, because the breakout rule that died when VIX hit 25 might come back at VIX 14. (For the full playbook structure -- Active, Testing, Inactive tiers and the daily loop -- see how to build a trading playbook from your reviews.)
Your playbook has three tiers: Active (proven, trade daily), Testing (accumulating data), and Inactive (shelved until conditions change). Nothing gets in without 20 tracked occurrences.
The pipeline never stops. Every session produces observations. Some become hypotheses. Some become rules. Some earn promotion. Some decay and get retired. That's the lifecycle. Your job isn't to find the perfect rule. It's to keep the pipeline running so your playbook evolves with the market instead of going stale.
TBTY automates this pipeline. Voice-capture your observations after the close, track rule performance across sessions, and see when a rule earns promotion or needs retirement. $9/mo founding rate, locked for life. Start here.
Keep Reading
- -The 9-Section Trading Review Template That Replaces Your Journal -- the structured review that feeds this pipeline every evening.
- -When Your Best Trading Setup Stops Working -- what to do when a promoted rule starts decaying.
- -Morning Prep Before Looking at Charts -- how your tested rules load into the next session's plan.
TBTY is an educational approach to structured trading review. Examples use ES futures for illustration only. Past patterns do not guarantee future results. Trading involves risk of loss. Always do your own analysis.
Want the complete framework?
This article is adapted from the TBTY framework. Get the free Quick Start Guide delivered immediately — two core ideas that fix most reviews.
Get the Free Quick Start Guide